The stock market in dollars and in gold. Two truths over 155 years.
Since 2020 the S&P 500 has risen 14.4 % per year in dollars. Measured in gold it has fallen. I go through 155 years of the stock market to show why, and where we stand today.
By Gustav Buder, CEO, Goobit Group AB (publ) · Published 23 October 2026 · Data through 23 October 2026 · 13 min read
+14.4 / −0.5
% per year for the S&P 500 since 2020, in dollars and in gold
3
falls of more than 85 % measured in gold: 1929–33, 1968–80 and 2000–11
≈90 years
to get back to the same level in gold, from the 1890s to 1980
43 %
of the S&P 500 sits in ten companies
Three things to know before you read
- The charts show price only, without dividends. That makes stocks look worse against gold than they are. Counting reinvested dividends, the S&P 500 has risen roughly a hundredfold measured in gold since 1925. Without dividends it has only tripled. We showed that in our previous analysis, The history of fiat currencies.
- Between 1981 and 2020 the stock market clearly beat gold. That was a period when interest rates fell for almost 40 years. Gold has not won everywhere.
- Bitcoin today costs less than half as much gold as at the peak. I believe in bitcoin long term, but over the past year gold has won. And patterns are not forecasts.
This is the fourth analysis in the series. This time I am not looking at the last ten or fifteen years. I am looking at the entire history we have for the roughly 500 largest companies in the US, that is the S&P 500 and its predecessors, from 1871 to today. That is more than 56,000 days.
My starting point is simple. Prices are set by us humans together, through supply and demand. So big events in the world, like wars, crises and decisions about money, should show up in prices. They do, and the pattern is clearer than I expected.
How to read the charts
The S&P 500 in its current form started in 1957. Before that there was a smaller index from 1923, and data going back to 1871 has been reconstructed by researchers, among them the economist Robert Shiller. The companies are replaced all the time, so it is not the same 500 companies in 1871 as today. But as a measure of how the largest American companies have developed, there is nothing longer.
I use a logarithmic scale. Then an equal percentage rise becomes equally tall in the image, whether the index stands at 5 or 5,000. Each bar is two months.
Below the price sits an indicator called RSI, Relative Strength Index. It compares how large the rises have been with how large the falls have been over the last 14 bars, that is just over two years, and gives a number between 0 and 100. High RSI means the rises have dominated. RSI usually moves in step with the price, but sometimes they diverge. Then the price has, for example, reached a new high while the strength behind the rise has grown weaker.
In the boxes I have marked each phase with how much it rose or fell and how many days it lasted. Green is trend phases, red corrections and blue consolidation. When I laid 155 years of the stock market side by side I saw the same four phases return again and again:
Consolidation
The market moves sideways, often for many years.
Breakout and trend
It breaks out and rises strongly for a long time.
Bubble
The trend overheats. The rise runs faster than anything else.
Correction
It crashes and often takes ten years to heal. Then phase 1 begins again.
The short ups and downs are noise. The events we remember as big in the economy, like 1929, 1987, 2000 and 2008, almost always happen at the end of a trend phase or in the transition to a new one.
155 years that look like a staircase
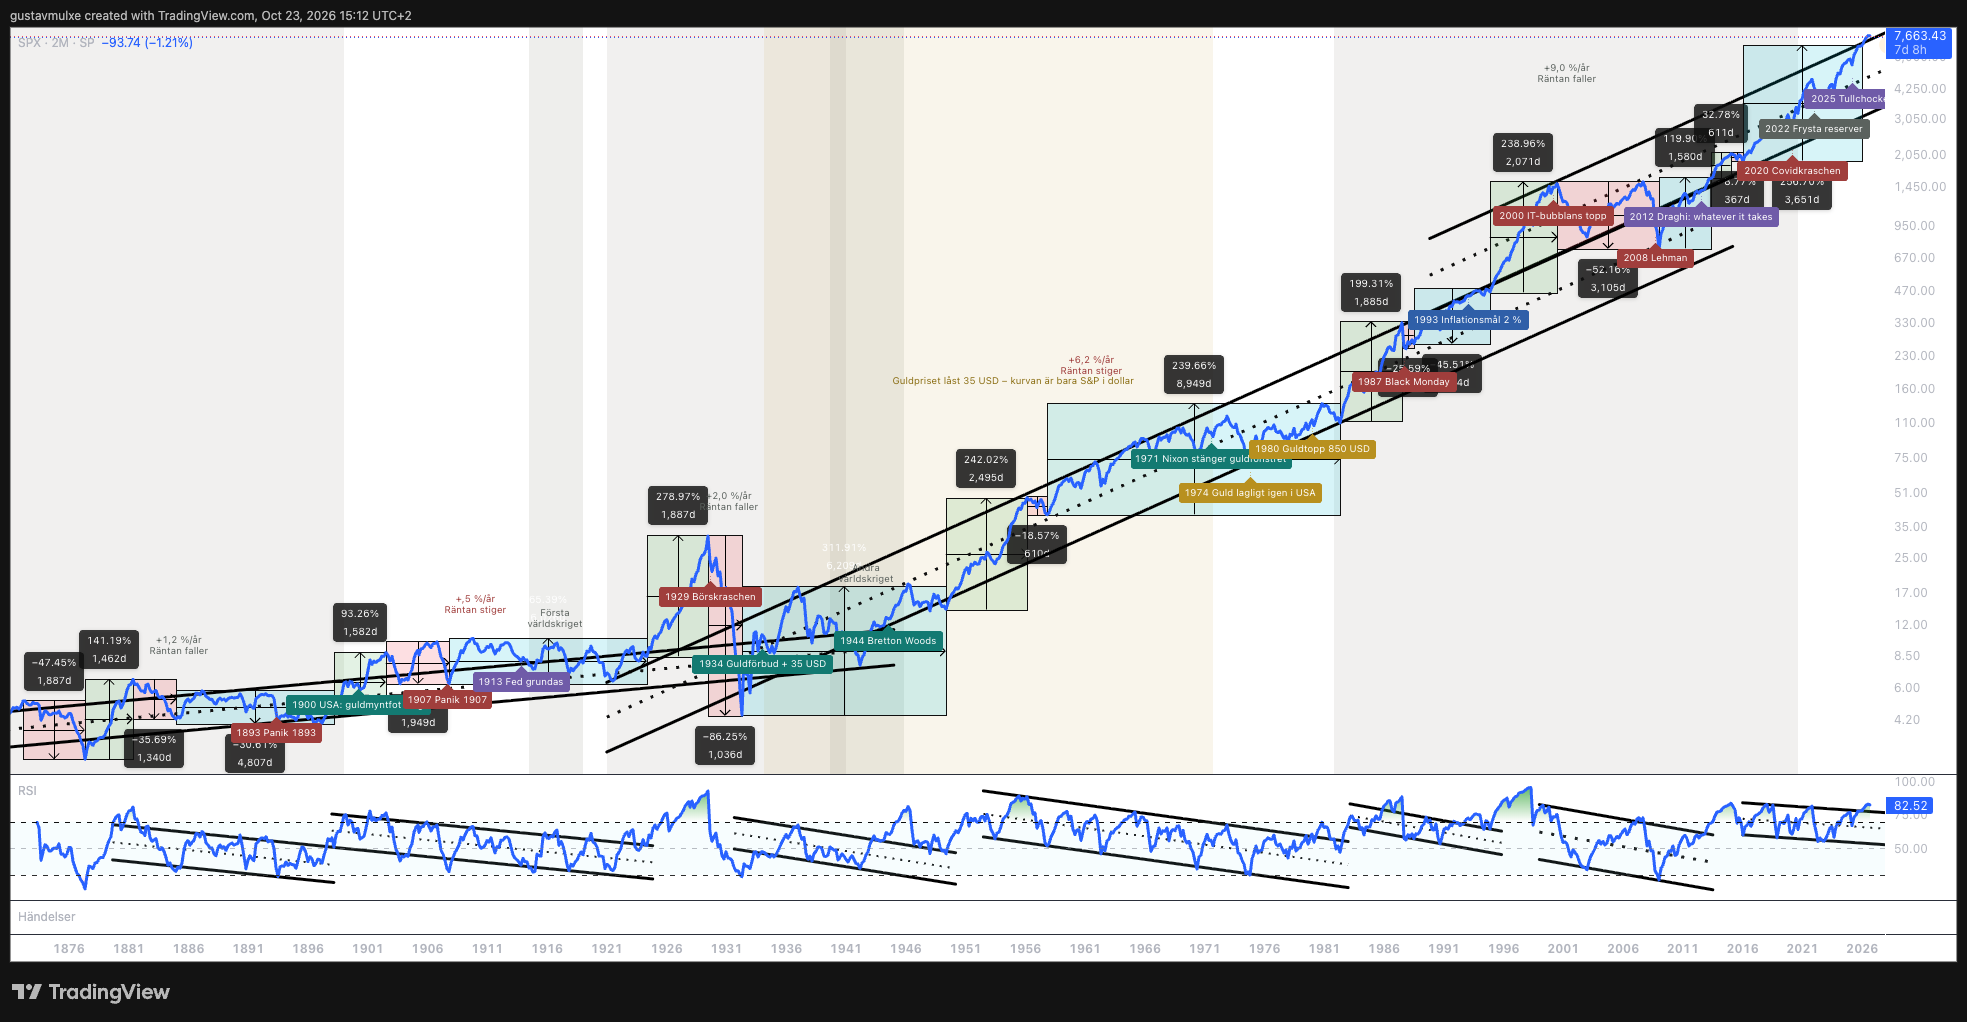
The index begins with a consolidation. Then comes the long depression of the 1870s, with a fall of 47 %, and straight after it a rally of 141 %. After the panic of 1893 the market moves sideways for 4,807 days, more than 13 years.
Follow the timeline below. It is the same cycle coming back, and what triggers it is almost always a decision about money or a war.
- 1893
The panic of 1893. Railway companies and banks collapse. Then 13 years sideways.
- 1900
The gold standard becomes law in the US (Gold Standard Act). The dollar is formally tied to gold, in the middle of a 93 % rise.
- 1907
Banking panic. J.P. Morgan organises the rescue. It leads to the discussion about a central bank.
- 1913
The Federal Reserve is founded. The US gets a central bank.
- 1914
The First World War. A trench war that became longer and more expensive than anyone expected. Countries borrow to keep it going. The krona leaves gold for the first time.
- 1920s
Breakout. After the war the market leaves the consolidation. The trend becomes a bubble and rises 279 % over 1,887 days.
- 1929
The crash. −86 % over 1,036 days. The largest fall in stock market history.
- 1931
Britain and Sweden leave the gold standard, both in September.
- 1933
Private gold ownership is banned in the US. Everyone must hand in their gold for 20.67 dollars per ounce.
- 1934
The dollar is devalued. Gold is set at 35 dollars per ounce, 41 % less gold per dollar.
- 1939
The Second World War. The market consolidates through the entire war.
- 1944
Bretton Woods. The world's currencies are tied to the dollar, and the dollar to gold for central banks. The argument was that the dollar was easier to trade and just as good as gold.
- 1949
Breakout. The post-war boom, +242 % over 2,495 days.
- 1971
Nixon closes the gold window. The dollar is no longer tied to anything.
- 1974
Gold becomes legal to own again for Americans, from the turn of 1974/75.
- 1980
Gold peaks at 850 dollars.
- 1982
Breakout after 8,949 days sideways, almost 25 years. Then +199 % over 1,885 days.
- 1987
Black Monday. The S&P 500 falls more than 20 % in a day. The full correction becomes −26 %.
- 1993
Sweden introduces its inflation target of 2 % after the early-90s crisis.
- 2000
The dot-com bubble bursts after +239 % over 2,071 days.
- 2008
The financial crisis. Lehman Brothers collapses. From the 2000 peak the index is down 52 % over 3,105 days.
- 2009
Bitcoin launches, half a year after Lehman.
- 2012
"Whatever it takes." ECB chief Mario Draghi promises to do what it takes to save the euro.
- 2015
Negative policy rate in Sweden.
- 2020
The covid crash. Short and quickly recovered.
- 2022
Russia's currency reserves are frozen. Central banks see that reserves held in dollars can be taken from them.
- 2025
The tariff shock.
- 2026
Breakout in RSI for the first time since 2012, and new records for the S&P 500.
Measured in dollars the stock market has almost always paid off in the long run, even if it took 25 years to recover after 1929. Notice how many of the great turning points are decisions about money: the gold standard, a central bank, the gold ban, the devaluation, Bretton Woods, Nixon, the inflation target, Draghi and the frozen reserves.
When the state took the gold
After the 1929 crash countries chose different paths. Britain and Sweden left the gold standard in 1931. The US did something far more radical.
In April 1933 private gold ownership was banned. Everyone who owned gold was forced to hand it in to the state and received 20.67 dollars per ounce. On 31 January 1934 the state decided that the same ounce was worth 35 dollars.
Imagine you are one of those who handed in their gold. First you are forced to sell at 20.67. Nine months later the same gold is worth 35. The dollars you received had lost 41 % of their value in gold, and you no longer had any gold to protect yourself with.
One can understand that the state wanted to act after the worst crash the world had seen. But to me this is one of the clearest examples of what happens to your money when someone else can change the rules. It is a restriction of people's freedom and of people's money.
It is also why the gold price sits still between 1934 and 1971, the beige band in the charts. Gold was not traded freely, the state held the price fixed. A yardstick someone holds still measures nothing.
1971 was not the first time the dollar lost its link to gold. For ordinary Americans it happened already in 1933. Everything that looks like a stable period in gold between 1934 and 1971 is a locked price, not a calm.
2026: the first breakout since 2012
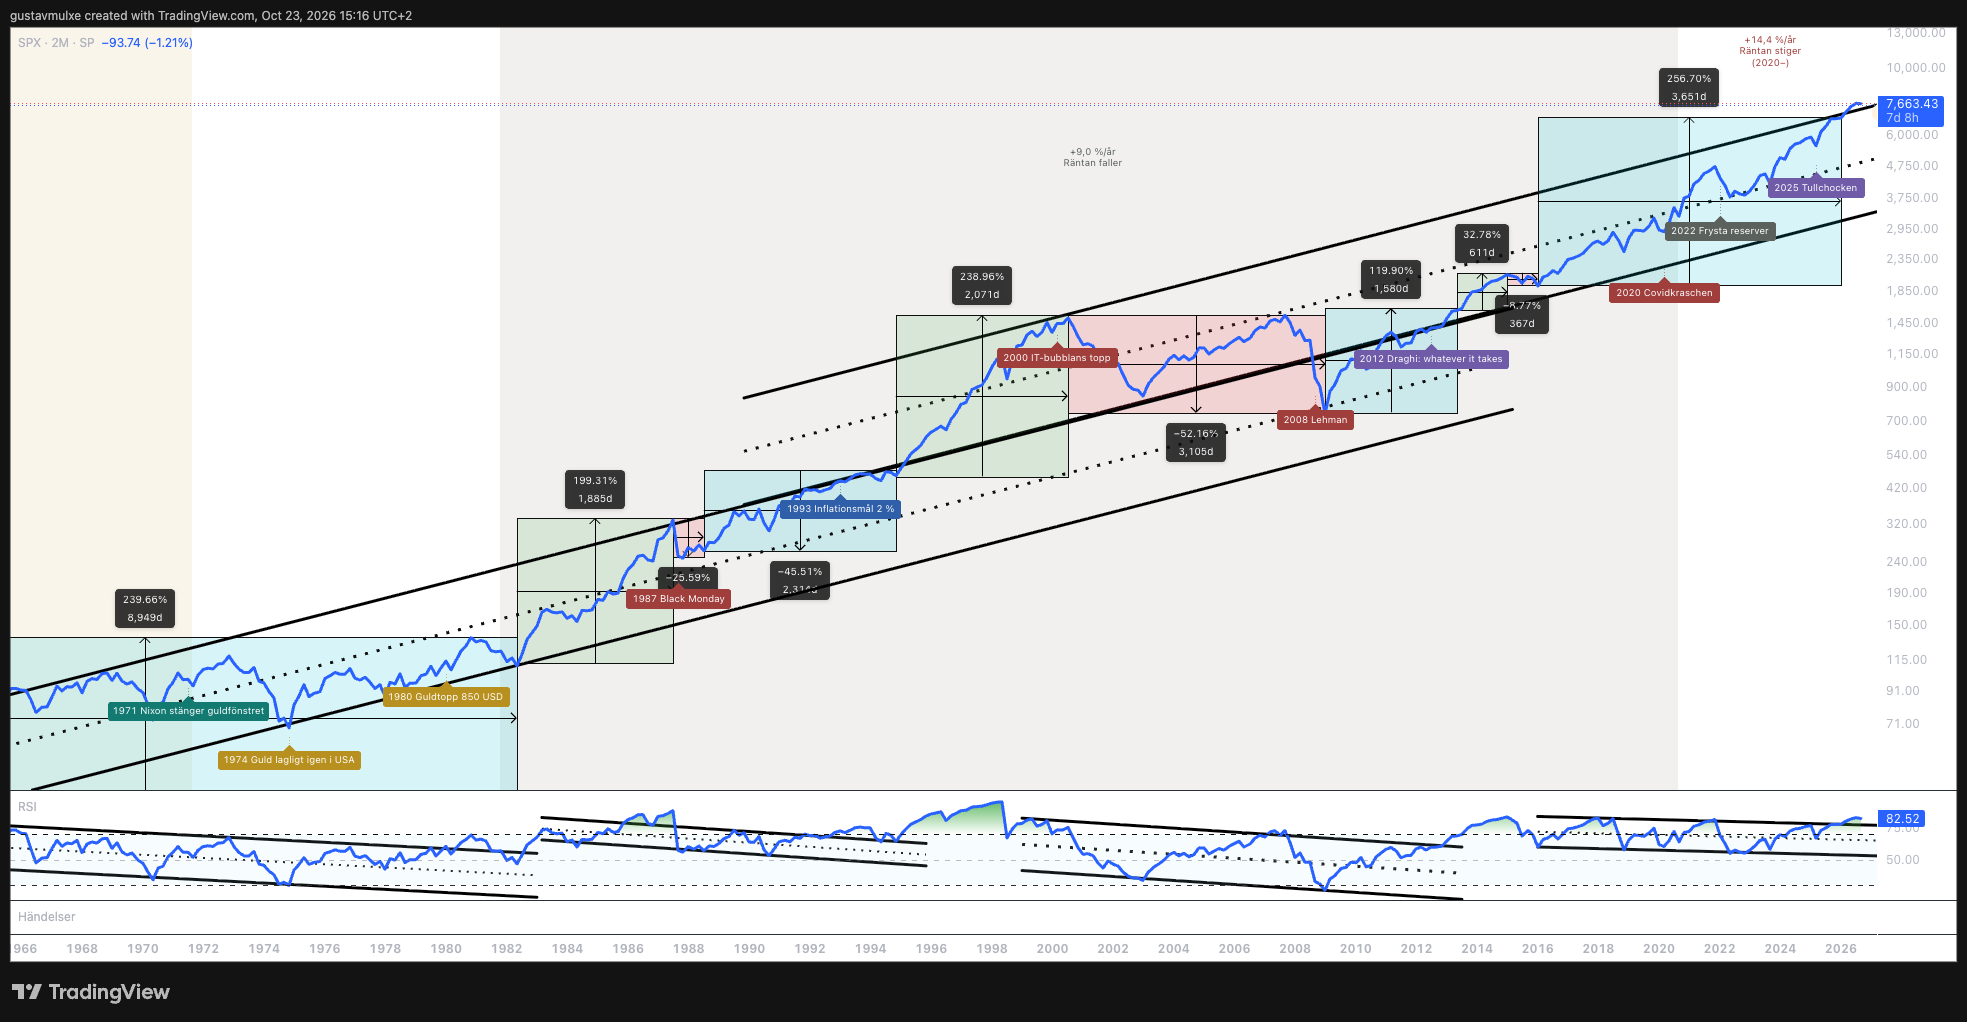
After the small correction in 2015 the S&P 500 has been in a consolidating phase in RSI all the way until this year. In 2026 RSI broke out for the first time since 2012. At the same time the index has broken out of the exponential trend channel it has been in, and set more than 25 new records this year.
Everything points to us being in a strong trend phase since the start of the year. The question is how long it can last. This is how long the most recent trend phases lasted:
How long did the trend phases last?
Days from breakout to peak, according to the markings in figure 2
611 days is 1.7 years and 2,071 days is 5.7 years.
Going only by these phases, a strong trend can last somewhere between just under two and just under six years. The current one has been running for about ten months.
Measured in dollars everything looks good. Since 2012 the declines have been small and short, probably thanks to the stimulus. It is easy to conclude that things only go up. That is why I now change yardstick.
Measured in gold the market has crashed worse than in the 1930s
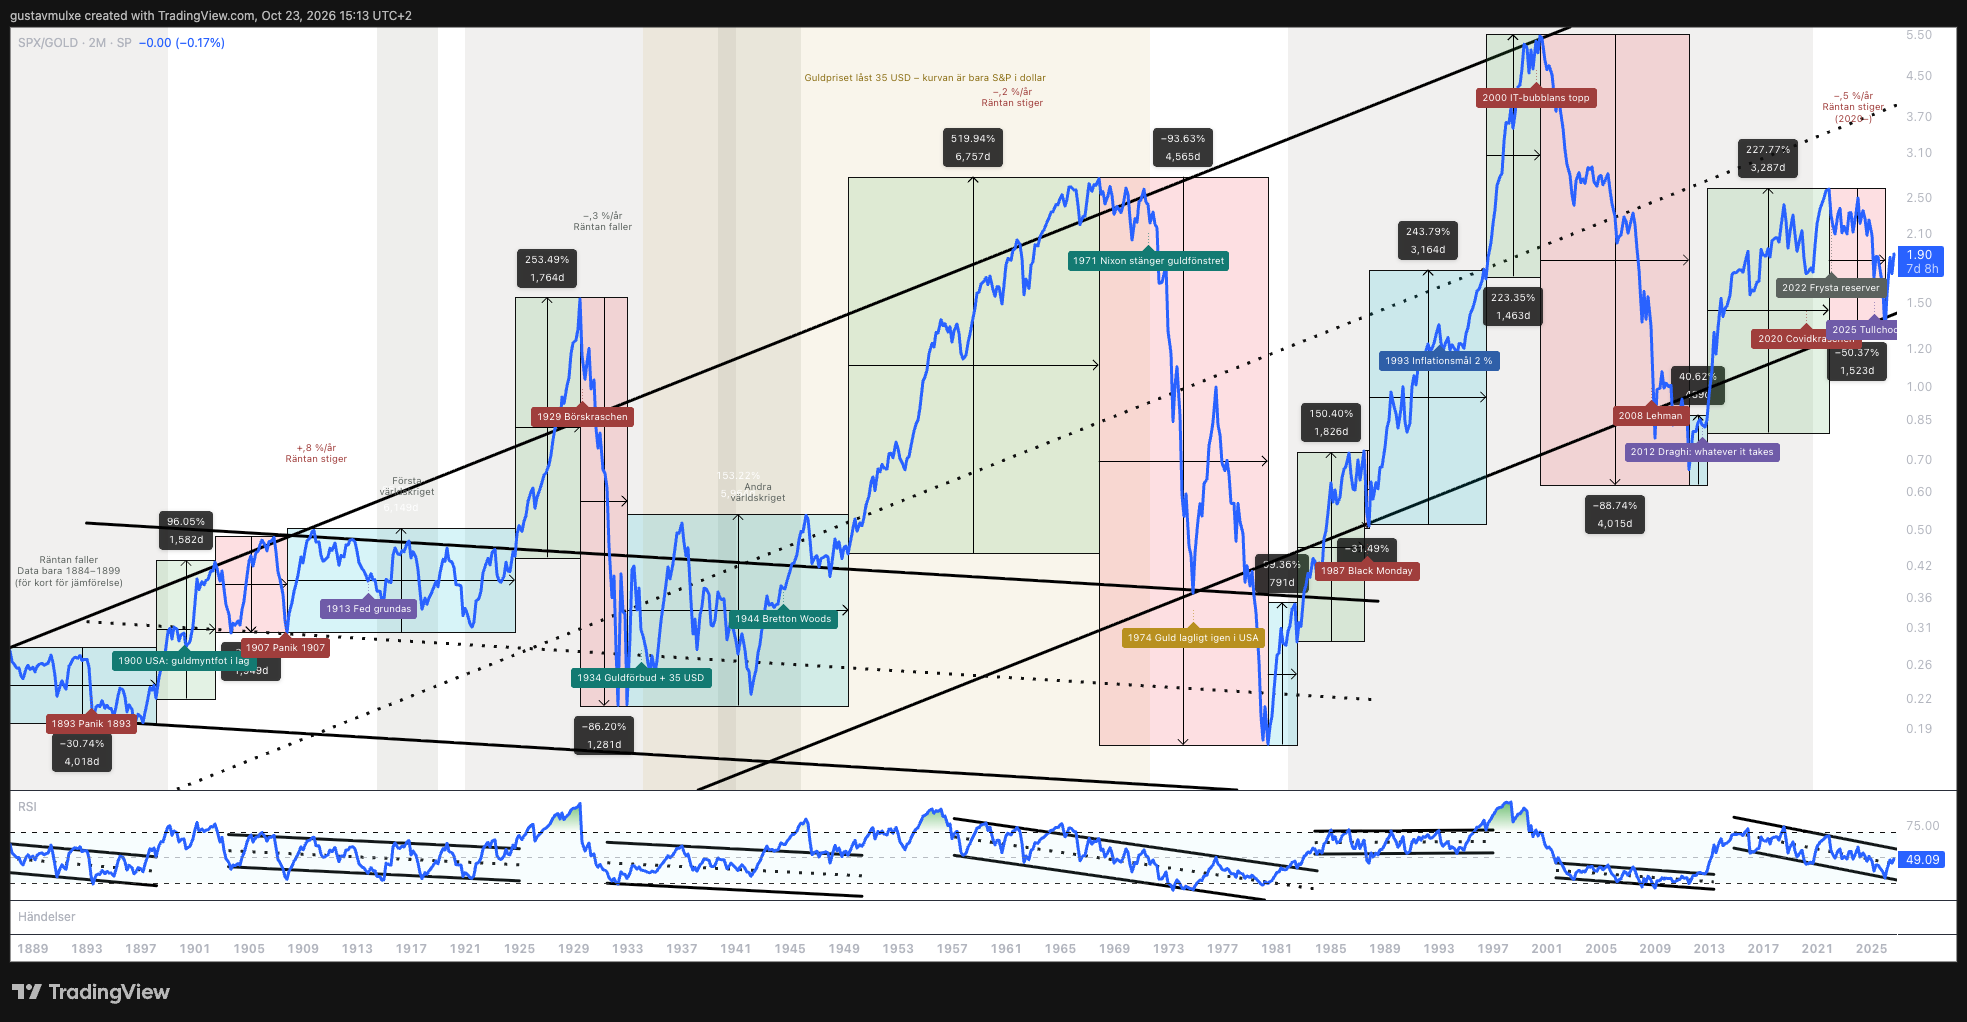
Now I do not measure the S&P 500 in dollars, but in how many ounces of gold the index costs. The picture changes completely.
Until 1980 the stock market had largely moved sideways or slightly down measured in gold. In 1980 the S&P 500 cost as little gold as in the 1890s, even a little less. So it took roughly ninety years to get back to square one. It should not be possible, but it happened.
The phases are the same as in dollars: consolidation, trend, correction. The difference is that the corrections become much deeper.
The great falls, measured in gold
From peak to trough, according to the markings in figure 3
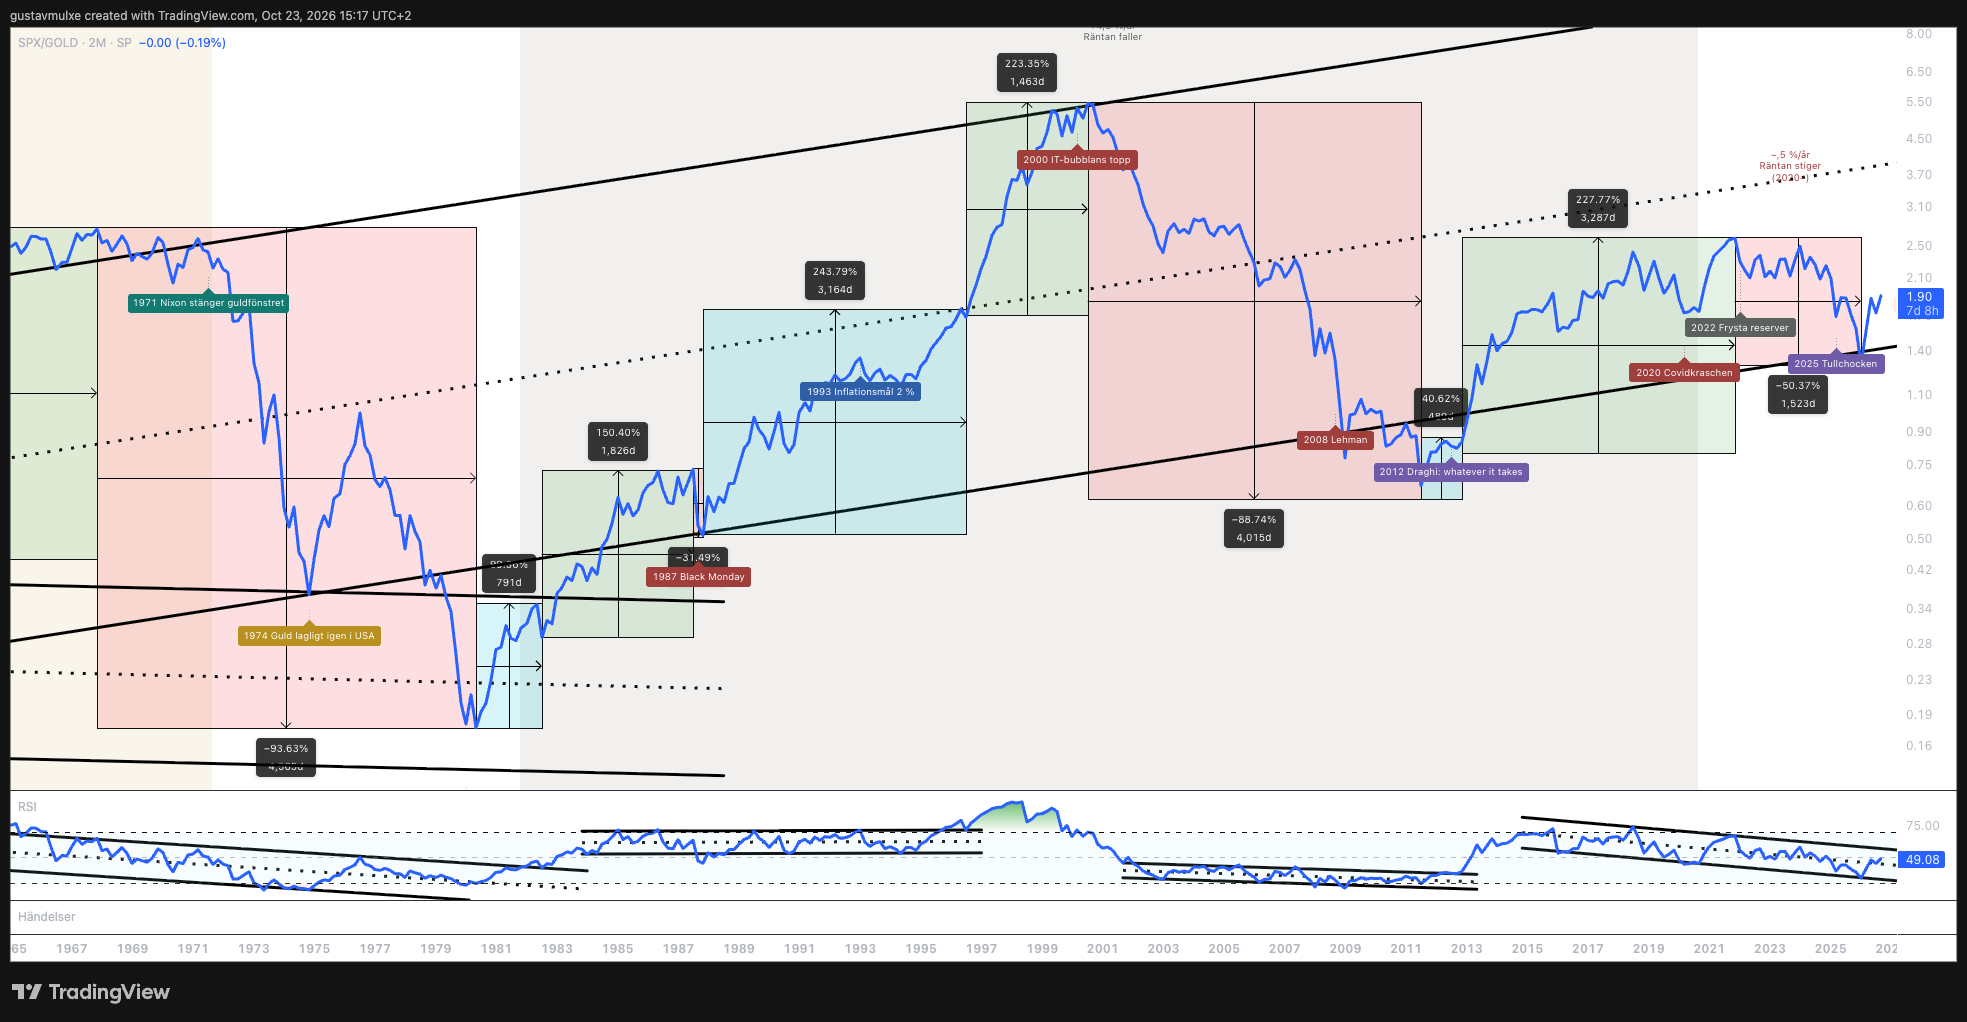
The most remarkable thing is the 1970s. When the gold window closed in 1971 came a fall that measured in gold was larger than the crash of the 1930s: 94 % against 86 %. We know the 70s were a tough time with high inflation. But nobody talks about it being as bad as the 30s or worse. If you see gold as money, and I do, then that is exactly what it was.
An important reservation: the strong trend 1949–1968, +520 % in figure 3, largely measures a fixed yardstick. The gold price was locked at 35 dollars. That is why the market looked better in gold than it would have with a free gold price, and why the fall after 1971 became so deep when gold was released.
Then came the 20 years when the stock market beat gold most clearly: from the bottom in 1980 to the peak in 2000. After that followed eleven years of crash against gold, −89 %, until 2011. Shortly after, the ECB promised to do whatever it takes. From 2012 to 2021 the market rose 228 % measured in gold.
That matches how people have experienced the last few years better than the dollar chart does. Most felt that 2012–2021 was a good time and that it has been tougher since. Exactly that shows in gold. From 2021 to the tariff shock in 2025 the market fell by half against gold and reached the lower trend line.
From the 2000 peak the market fell at most 52 % in dollars and was back at records by 2013. Measured in gold it fell 89 % until 2011. It is the same stock market. The only difference is what you measure with.
Two truths about the same market
In the charts I have also divided history by how interest rates moved and calculated how much the market rose per year in each period, both in dollars and in gold. This is perhaps the most important table in the whole analysis.
S&P 500 per year in different rate periods
| Period | Rates | In dollars | In gold |
|---|---|---|---|
| 1871–1899 | falling | +1.2 % | too little data |
| 1899–1920 | rising | +0.5 % | +0.8 % |
| 1920–1946 | falling | +2.0 % | −0.3 % |
| 1946–1981 | rising | +6.2 % | −0.2 % |
| 1981–2020 | falling | +9.0 % | ≈ +5 % |
| 2020–2026 | rising | +14.4 % | −0.5 % |
Price only, without dividends. The values are taken from the markings in figures 1–4. The period boundaries are set by hand and differ slightly between the charts. The 1981–2020 value in gold is an approximate calculation, since the label is not visible in the images.
Measured in dollars the market has moved faster with every new period: from just over 1 % per year in the 19th century to 14 % per year since 2020. Measured in gold it has stood almost still in every period but one.
The exception is 1981–2020, when rates fell for almost 40 years. Then the market beat gold properly. I say that openly, because it is part of the truth. But notice what happened when rates turned up in 2020. In dollars the market has never risen faster. In gold it has not risen at all.
In dollars
An exponential trend that gets steeper with every period. New records in 2026 and a breakout in RSI.
In gold
No trend at all over 137 years, just a long consolidation. Four falls of 50 % or more, three of them over 85 %. Only during the long rate decline did the stock market clearly beat gold.
The biggest reason the dollar curve looks so exponential is that the money supply has grown enormously. In our first analysis, The big trend since 1971, we showed that the US money supply M2 has grown 37 times since 1971. When there are so many more dollars, everything that is scarce rises, measured in dollars. Stocks too.
That does not mean stocks are a bad investment. Stocks are ownership with risk, and that risk should pay. The point is another: if the money itself had kept its value, you would not have needed to become an investor just to stand still.
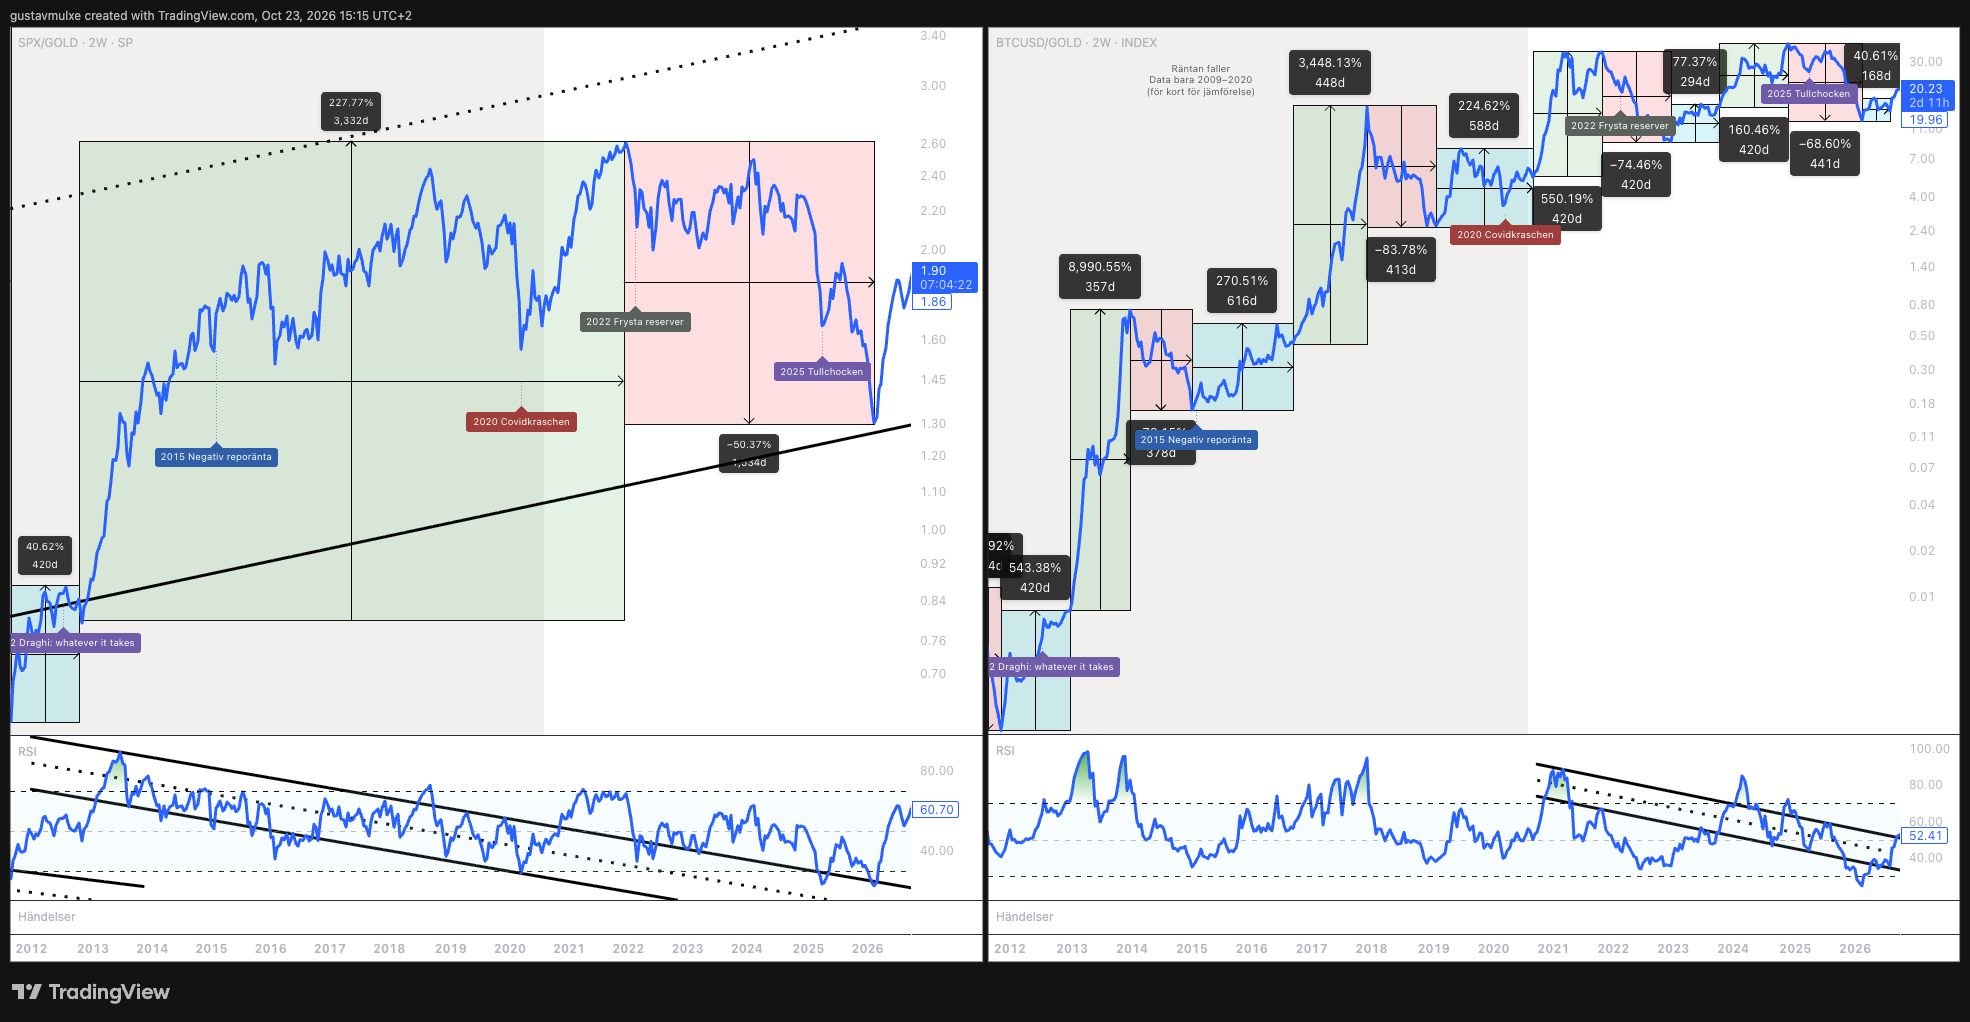
On two-month bars the market has not yet broken out in RSI measured in gold. RSI sits at 49, in the middle of its falling channel. If you zoom in to two-week bars, on the left in figure 5, RSI has however just broken the line it has followed down since 2021.
This most resembles the period around Black Monday. First came ten years of crash against gold, then a short but strong rise and a correction before the great trend came. That trend was the IT era, when the internet took the world by storm.
Now we face a new technical shift with AI and robots. It may mean we are entering a market that differs from the last 20–30 years and more resembles 1987–1996.
Two things are new. The money supply has never been larger, and that drives the gold price more than before. And the S&P 500 is not the same index as before: 43 % of it sits in ten companies, all technology companies riding the same trend.
Anyone who only reads the dollar chart sees a market in the middle of a strong trend. Anyone who reads the gold measure sees a market that still has not recovered the loss against gold since 2021. Both are true, but only one of them answers whether your money has kept its value.
The same cycles, only faster
Bitcoin launched in 2009, half a year after Lehman. On the right in figure 5 I have measured bitcoin in gold on two-week bars. What I see is the same four phases as in the stock market, but the cycles are much shorter and the swings much larger. I believe that is because bitcoin is such a young asset.
The rises are hard to even imagine: +8,991 % over 357 days in 2013, +3,448 % over 448 days in 2017. The falls are just as brutal: −84 % in 2018, −74 % in 2021–2022 and −69 % the most recent time, measured in gold.
The uncomfortable part first: the most recent fall came after the peak around the turn of 2024/2025. Since the bottom bitcoin has risen 41 % over 168 days, but today one bitcoin costs 20 ounces of gold. That is less than half of the peak.
Based on this analysis, bitcoin so far behaves more like the stock market than like an alternative to gold. It does better than gold when the market does better than gold. During the 2012–2021 trend, when the market rose against gold, bitcoin rose even more. After 2021, when the market fell against gold, bitcoin stood largely still against gold for several years. It did not fall as much, but it did not rise either.
In RSI, bitcoin has moved in a falling channel since 2021. Now, after the rise from the bottom, it is about to break out of it.
I believe bitcoin can be the asset that fares best in a world where technology develops faster than ever, where geopolitics is uneasy and where the money supply grows like never before. I believe bitcoin has a great deal on its side over the coming five to twenty years.
Bitcoin has also fallen more than 70 % four times since 2009 measured in dollars, and does not yet have a single thirty-year period to be measured against. I see bitcoin as money for generations, not for years.
Anyone who buys bitcoin as protection against a falling stock market has so far not got that. Anyone who buys bitcoin because it wins when scarce assets and new technology win has a 17-year history supporting it, with very large swings along the way.
What 155 years teach us
The stock market moves in long cycles of consolidation, trend, bubble and crash. The great turning points often coincide with decisions about money.
The yardstick decides what you see. In dollars the market has moved faster with every period, and fastest since 2020. In gold it was in 1980 back where it stood in the 1890s, has crashed more than 85 % three times and has not risen at all since 2020. The difference is the money supply.
Bitcoin so far follows the stock market more than gold, in faster cycles. Measured in gold it today costs less than half of the peak. My assessment is that it has the most on its side over the coming 5–20 years, but that is an assessment and not a result.
Thank you for reading. Feel free to write what you see in the charts and which insights you take with you. See you next week.
Past performance is no guarantee of future returns. Futureproof is a service from Goobit Group, which sells bitcoin. I am the CEO of Goobit Group and own shares in the company. This is my analysis and not personal investment advice. Past performance is no guarantee of the future, and what you save can become worth less.
Sources and method
- Charts: five screenshots from TradingView (SPX, SPX/GOLD and BTCUSD/GOLD) with TradingView's attribution, according to their terms for use in analyses and articles. No data has been exported from TradingView. Percentages, days and percent per year are my own markings in the charts.
- S&P 500 before 1957: back-calculated series (Cowles Commission and Robert Shiller, Yale).
- Historical events: Federal Reserve History (Gold Standard Act 1900, Panic of 1907, Federal Reserve Act 1913, Executive Order 6102 1933, Gold Reserve Act 1934, Bretton Woods 1944, Nixon 1971), Riksbanken (the gold standard 1931, the inflation target 1993, the negative policy rate 2015), ECB (Draghi's speech 26 July 2012).
- Levels as of 23 October 2026 according to the images: S&P 500 7,663, S&P 500 measured in gold 1.90 ounces, bitcoin measured in gold 20.2 ounces.
- Money supply M2 ×37 since 1971: our analysis The big trend since 1971. Top 10 weight 43 %: our analysis Who beats true-flation? Dividends in gold since 1925: our analysis The history of fiat currencies.
Uncertainties
- Where a phase begins and ends is a judgement, and the rate period boundaries are set by hand.
- All charts show price without dividends. With reinvested dividends, stocks look considerably better against gold.
- The gold price was fixed 1934–1971 and administered before 1934. In those periods the S&P/gold ratio in practice measures only the S&P in dollars.
- RSI is a measure of momentum, not a forecast.
Be there from the start
The service has not launched yet. Join the waitlist and we will be in touch when we open.
Investing involves risk. Your savings can go both up and down in value.